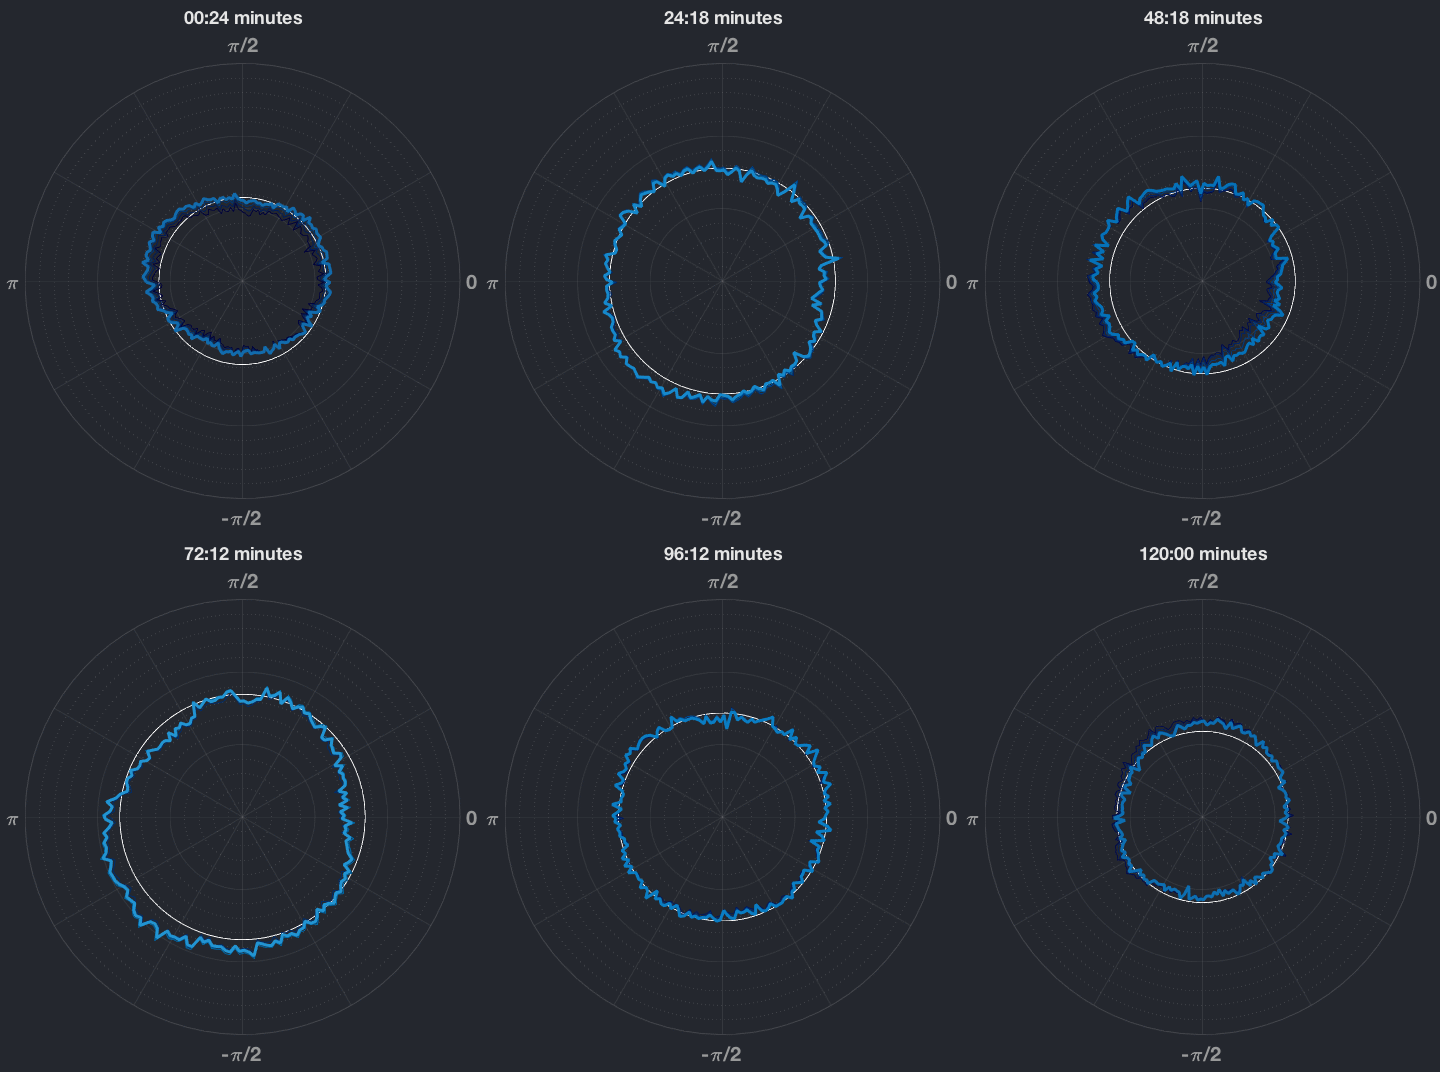
The relationship—over 2 hours (sped up 150x here)—between the "power" (how large the signal is, blue line) in the
gamma band (brain activity oscillating between 30–100 Hz here, though for actual research purposes this should be split
into smaller frequency bands since they represent different activities) and the instantaneous "phase angle" of the activity in the
theta band (4–7 Hz).
The phase angle effectively denotes whether the signal in that frequency band is at, or on its way to, a maximum or minimum.
The white circle shows the average power in the gamma band at that instant across all phases, to aid visualizing what angles
have higher or lower power than expected for that moment in time.
